3 min read
Explore Our ESG Dashboard: A Comprehensive Walkthrough
Navigating to the main homepage of our dashboard, you’ll find an overview that clearly explains its contents. This dashboard not only showcases ESG insights but also focuses on the Global Impact Index, providing a comprehensive view of all risk domains, including detailed ESG analysis.
Dashboard Sections
- Overview – the Overview section shows trends for the ESG and Global Impact indexes.
- Benchmark – the Benchmark section allows you to compare companies and industries.
- Top Movers – the Top Movers section tracks significant changes in ESG scores.
- Detailed View – the Detailed View breaks down each category within the ESG framework.
Using the Overview Page
Starting on the Overview page, you’ll see a filter at the top left where you can select a date range, view type (ESG Index & SV GII or Beneficial/Adverse), index, industry, country, and company. For example, set the date range from February 17 to April 23, 204, choose ESG Index & SV GII, select index 500, and set the view to Beneficial/Adverse for all industries and countries, focusing on Amazon.
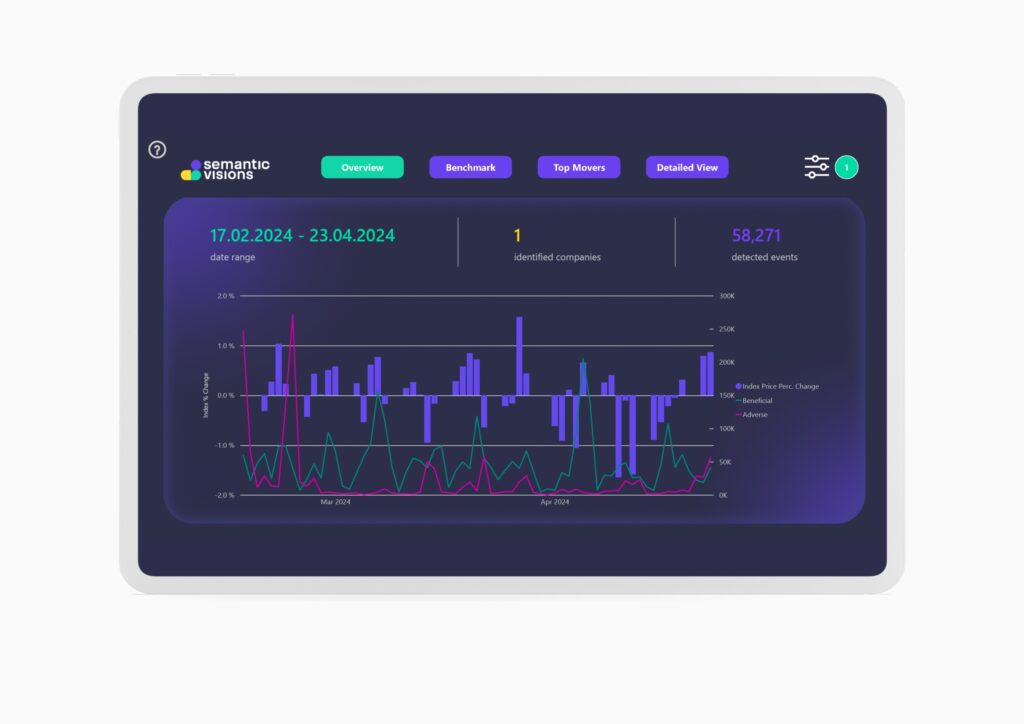
This setup will display trends over time, showing how many companies are involved (in this case, just Amazon) and associated articles (58,271 detected). The graph illustrates a timeline on the x-axis and index percentage change on the y-axis, highlighting “Beneficial” events in green and “Adverse” events in pink, and how the S&P 500 index price changes. This helps you track and analyze trends for Amazon, identifying patterns in beneficial and adverse events.
Exploring the Benchmark Section
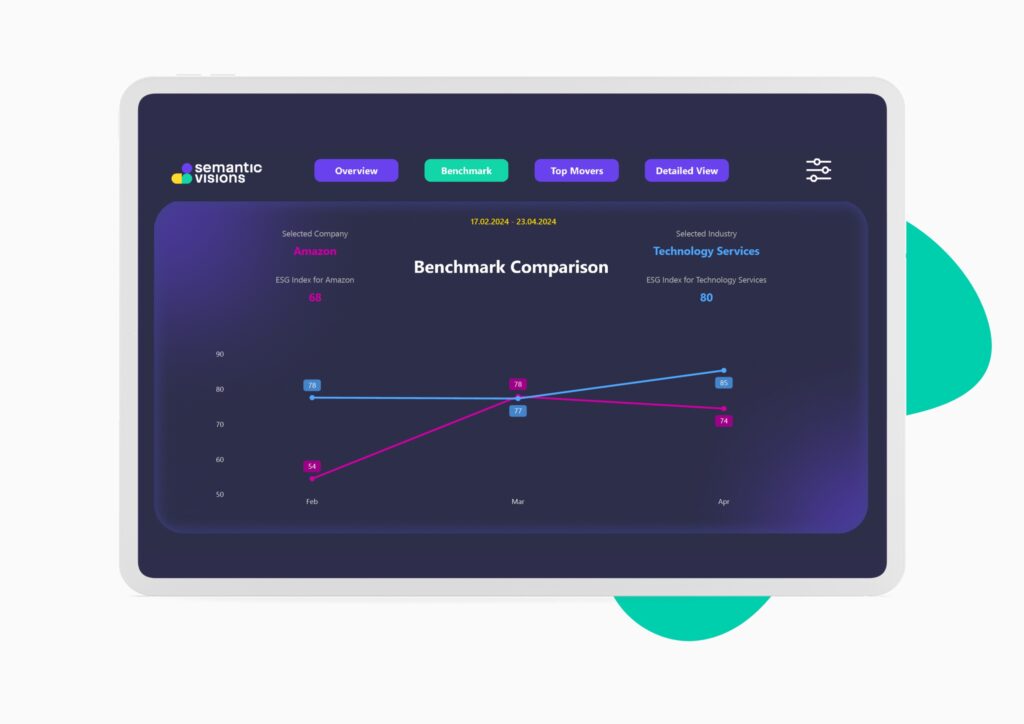
In the Benchmark section, the same filters are available. Keep the time frame consistent with your previous selection. For metrics, continue with the ESG index, and compare Amazon to the “Electronic Technology” industry. This comparison shows how Amazon’s performance (score of 68) compares to the industry average (score of 80).
Analyzing Top Movers
In the Top Movers section of our dashboard, users can dynamically explore changes in Environmental, Social, and Governance (ESG) performance by applying filters for year, month, and metrics like the ESG index or SV GI Index, focusing on either industries or specific companies. You can view up to five top or bottom movers.
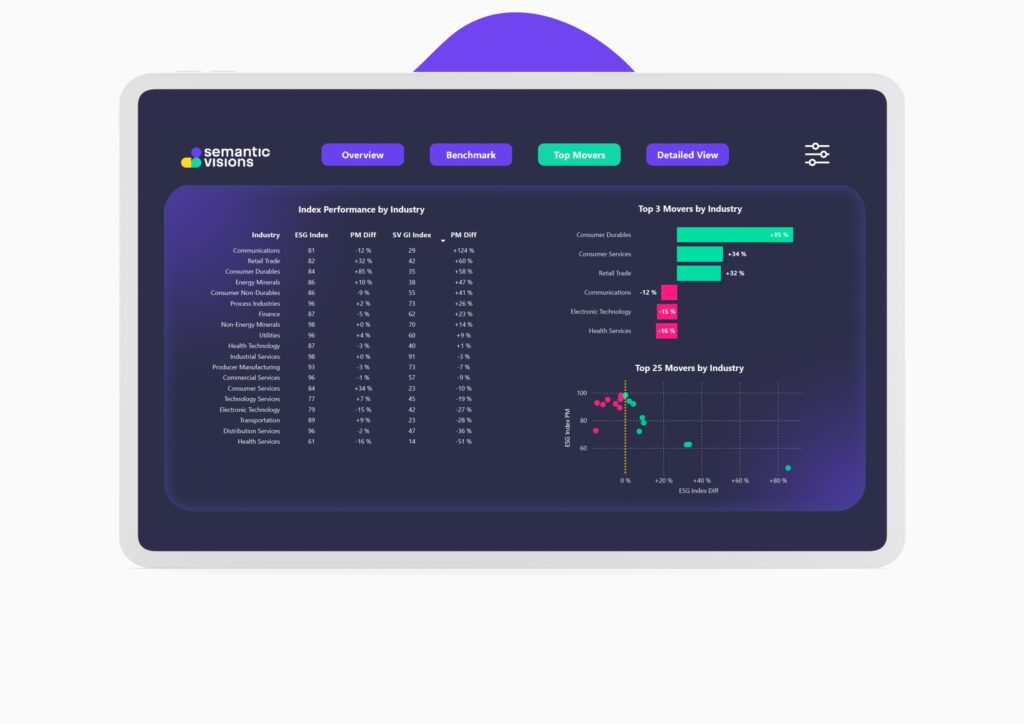
For March 2024, with the industry dimension selected, the overview on the left shows ESG and SV GI Index scores, highlighting which industries have seen the most significant changes. This includes a percentage difference from the previous period for quick trend analysis. On the right, you’ll find details of the top and bottom three movers by industry based on their ESG index changes. Below this, a scatter plot titled “Top 25 Movers by Industry” illustrates the percentage improvements in ESG scores across various sectors, ranging from 0% to over 80%. A yellow line divides the top from the bottom movers, with the x-axis showing ESG Index Difference and the y-axis showing ESG Index PM. This visual helps identify industries that have maintained high scores and those with substantial improvements, offering insights into ESG performance trends and sector shifts.
Delving into the Detailed View
Finally, the Detailed View offers a deeper look into why Amazon’s ESG score appears as it does on the overview. By exploring the E, S, and G levels, you see Governance (G) scores particularly low at 46, mainly due to issues in Corporate Ethics and Compliance. This section allows for an in-depth analysis of areas where Amazon excels and where it needs improvement.