Navigating the Cocoa Market in 2024: How Real-Time Data Shapes Trading Decisions
Semantic Visions technology offers a comprehensive solution to track and analyze key developments across trading areas, from commodities to indices. Leveraging Semantic Visions’ proprietary curated data, we provide real-time insights that keep you ahead of critical market shifts.
Our feeds capture significant price movements and emerging trends, delivering timely, actionable information across commodities and indices. By staying ahead of key developments, you can spot opportunities and make informed decisions. With our data insights, you gain a strategic advantage by understanding the critical changes shaping the trading landscape, empowering smarter, data-driven decisions.
Imagine you’re a commodity trader and you deal in cocoa in early 2024, watching the market closely as prices slowly rise. Everything seems normal at the start of the year, but then, at the beginning of February, things take a sudden turn. Prices start climbing faster, and you need to understand why. This is where Semantic Visions’ data becomes invaluable, helping you track the disruptions causing these price changes.
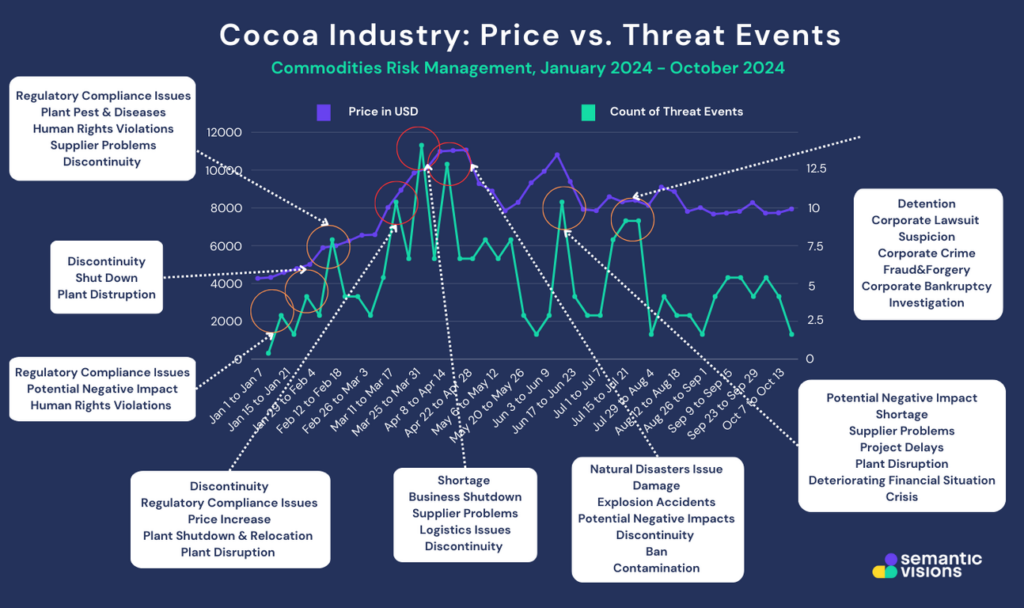
Chart 1: Coca Pricing Trends vs. Count of Threat Events
(illustrates the relationship between cocoa pricing trends and the count of threat events, highlighting how external pressures directly impact market dynamics)
Chart 2: Global Cocoa Events Map: Key Locations of Cocoa-Related Events
(highlights global hotspots of cocoa-related events, pinpointing regions impacted by disruptions)
January: Early Signs of Trouble
In January, the cocoa market is relatively calm. Prices are ticking upward, and the chart shows a steady increase. But as you look deeper into Semantic Visions’ data, subtle warning signs start to appear. Reports of regulatory compliance issues and human rights violations in key cocoa-producing regions, like West Africa, are emerging. While these threats haven’t yet impacted the market drastically, they hint at potential future problems in the supply chain.
February: Threats Intensify, Prices Surge
By the beginning of February, things begin to change. The chart shows a noticeable spike in both the number of threats and cocoa prices. Semantic Visions flags a rise in supplier problems, discontinuity, and plant pests & diseases. The media is reporting on labor strikes, disruptions in production plants, and transportation issues. These events start to limit the cocoa supply, pushing prices higher. As you watch the market react to these disruptions, it’s clear that the supply chain is under stress, and traders are scrambling to secure their stock.
March: The Peak of the Crisis
Late March brings the highest number of threat events—and the highest cocoa prices—of the year. The chart shows a clear correlation between these supply chain disruptions and the steep rise in prices. You get a clearer picture: plant shutdowns, relocations, and logistical challenges are severely affecting the availability of cocoa. With fewer shipments making it to market, the price surges. We notice that this price spike isn’t just about demand—it’s a direct response to the chaos in the supply chain.

Chart 3: Cocoa Market Volatility – Price and Threat Events with Detailed Disruptions (illustrates the correlation between cocoa prices and specific disruptive events throughout 2024)
April to June: A New Wave of Issues, Not Total Calm
Contrary to expectations of stabilization, April brings another spike in threats. Our data shows that while prices begin to stabilize, the number of discontinuities and plant disruptions remains high. Though there are fewer peaks than earlier in the year, the disruptions still influence cacao prices, which remain elevated but slightly less volatile.
July to October: Corporate Risks Add New Uncertainty
In the latter half of the year, prices stabilize, but there’s still some fluctuation. SV data reveals threats beyond supply chain logistics—corporate lawsuits, fraud, and financial instability—indicating a new type of risk. These issues impact the overall market sentiment, but without the severe plant and supply disruptions seen earlier in the year. By this time, traders are better able to anticipate and prepare for smaller market shifts. Although the spikes are less dramatic, the presence of these threats shows that the cacao market remains sensitive to broader corporate and financial risks, rather than just traditional supply chain disruptions.
A Year of Insights
Throughout 2024, Semantic Visions has helped you stay ahead of the market. By providing real-time data on threats like plant disruptions, and regulatory changes, you can see how these events directly influence cocoa prices. Rather than acting retrospectively, you’re able to anticipate changes in the market and make informed decisions. The chart above tells the story of how interconnected global events can affect something as simple as the price of cocoa—and how using relevant and accurate data can make all the difference in navigating those changes.
Curious to learn more? Want to see our data in action?


