Daily Insights on S&P 500 Companies
Gain real-time visibility into key events impacting S&P 500 companies. Our interactive dashboard provides a comprehensive daily overview, allowing you to monitor trends and make informed decisions.
What’s Included in the Chart?
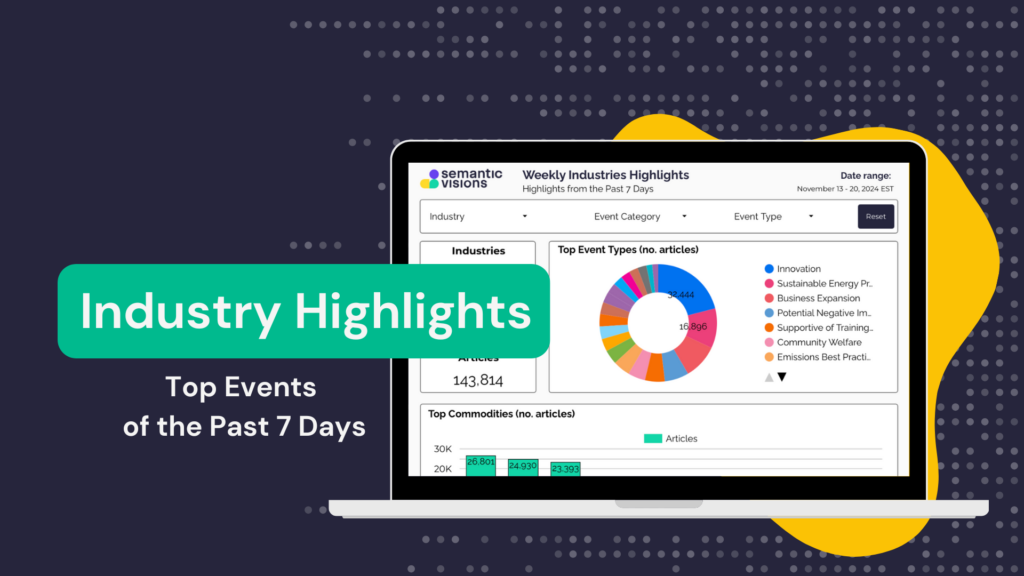
This dashboard provides a daily analysis of events affecting companies within the S&P 500 index. Key metrics include:
- Entities: The count of companies mentioned in the media on the selected day.
- Scenarios: The total number of event scenarios tracked across all companies.
- Articles: The volume of articles/media coverage feeding into each scenario.
The visuals highlight the most frequent Event Types and Top Companies by article count, helping to identify which companies are receiving notable attention.
How Can This Insight Benefit You?
By offering a snapshot of daily events for key S&P 500 companies, the SV dataset enables you to:
- Track Trends: Identify emerging trends and topics that impact major companies.
- Spot High-Intensity Events: See which companies and event types have higher intensity scores, indicating potentially significant impacts.
Whether you’re an investor, analyst, or business professional, these insights provide valuable information for decision-making and staying up-to-date on key developments within the S&P 500.
Disclaimer: The data presented herein are preliminary and may contain inaccuracies or statistical errors. These datasets are intended for informational purposes only and do not constitute official reports. For comprehensive and validated data analyses, our clients receive refined outputs that undergo rigorous quality assurance processes to ensure accuracy and reliability.
Are you interested in other indices?
We can provide insights and analysis for a range of indices, including examples such as the US Nasdaq 100, Global MSCI World, Europe STOXX 600, Japan Nikkei 225, and China SZSE 300.


